
FREED Study · Free download
Home and Decor market: what people search for most on Google Chile
We analyzed 5 million searches in the Home and Decor category to understand consumer purchase intent and measure the market share of 17 e-commerce stores and marketplaces.
Note: the PDF is in Spanish. An English version is coming soon.
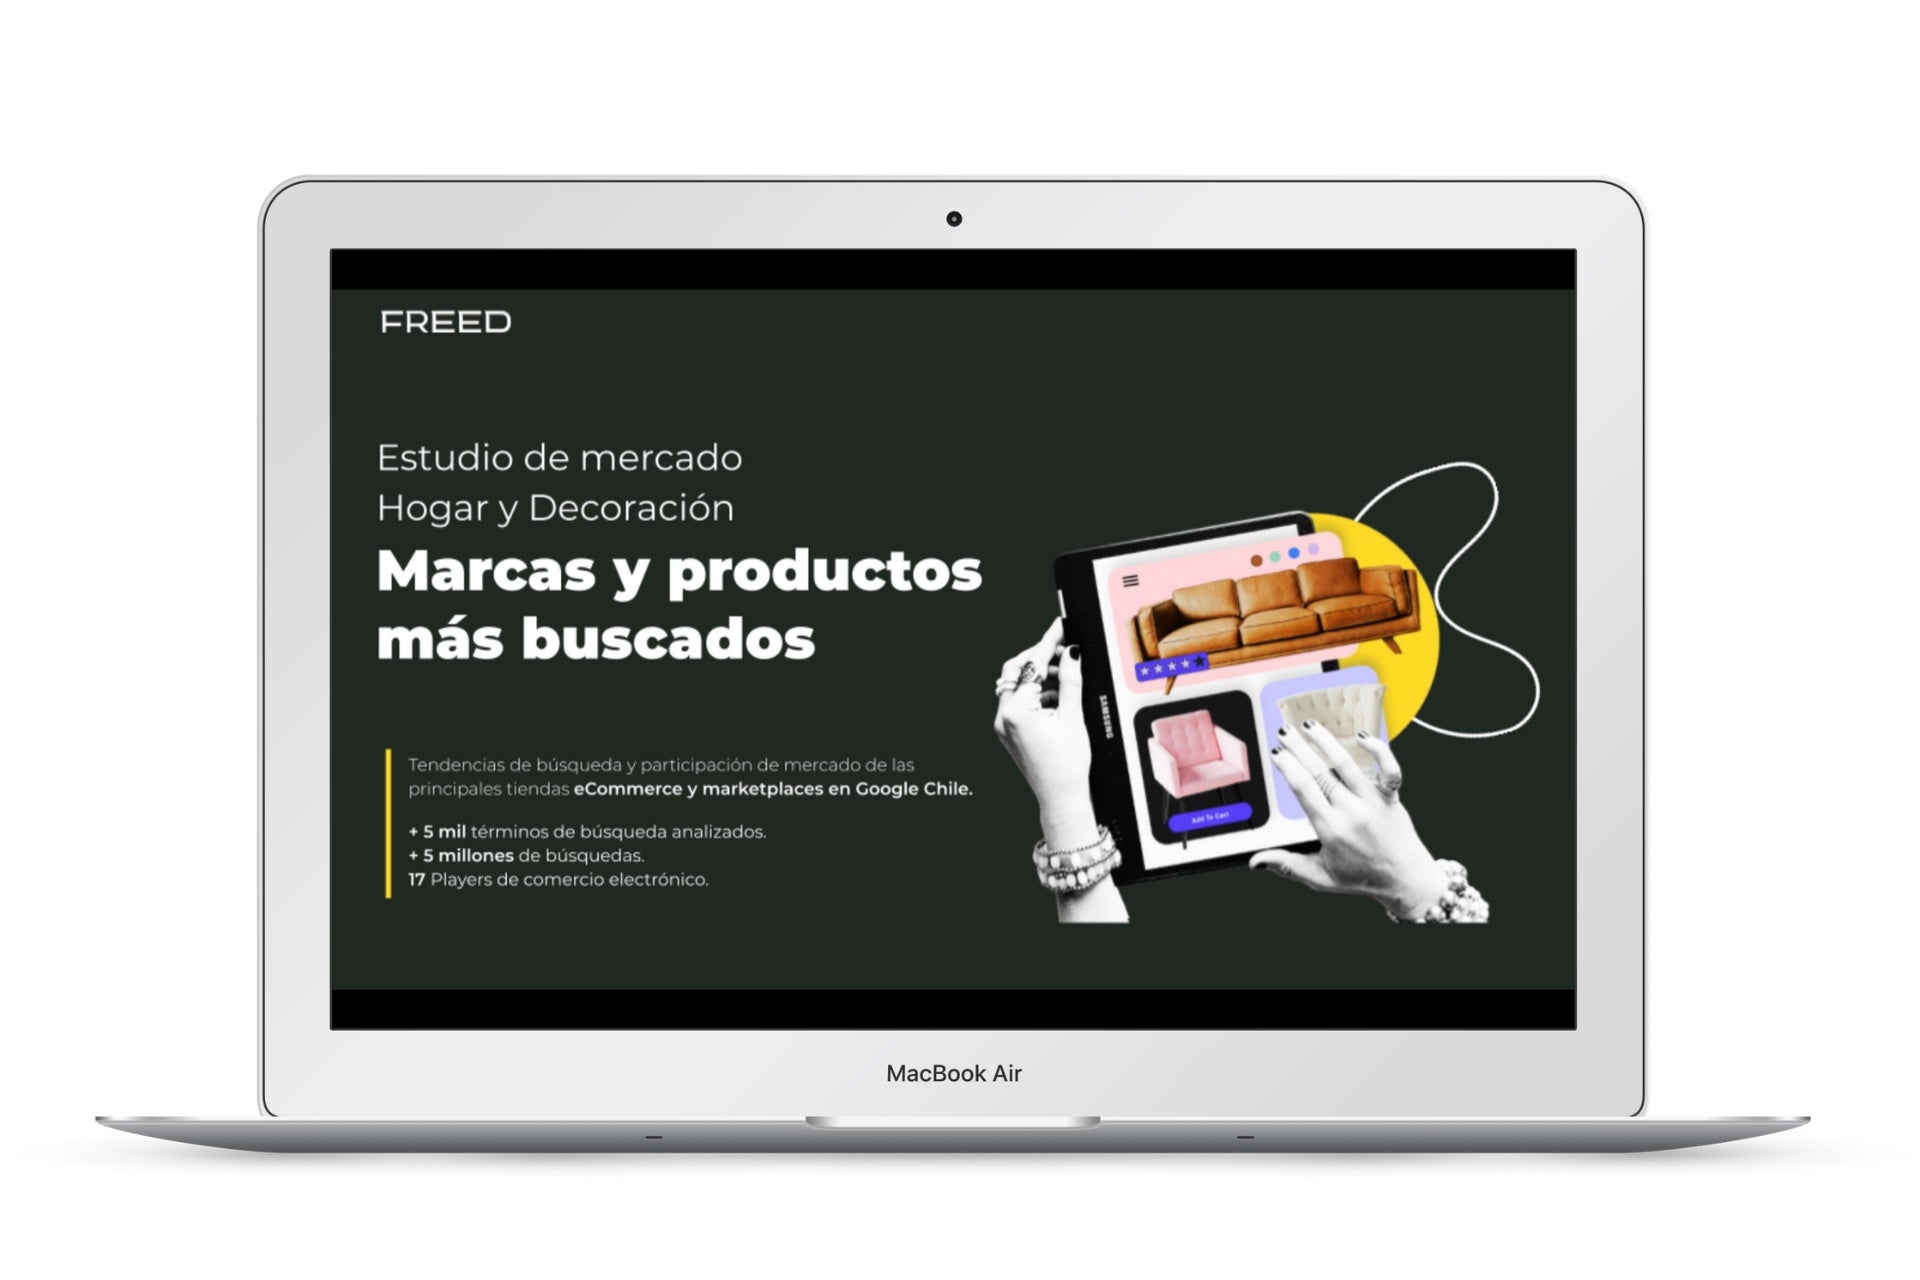
- keywords researched
- 5,830
- searches analyzed on Google Chile
- 5 M
- E-commerce stores and marketplaces
- 17
- product subcategories detected
- 118
The context
2020: the year that accelerated e-commerce
The pandemic transformed consumer behavior: online shopping and research accelerated, and segments that had never bought online before did so for the first time.
27.6%
growth in global e-commerce sales in 2020, which surpassed 4 trillion dollars
36.7%
E-commerce growth in Latin America in 2020: the highest in the world
7 in 10
digital shoppers in Chile increased how often they bought online during 2020
98%
market share Google holds among search engines in Chile
Search trends in Chile
The 20 most searched subcategories
We classified every keyword to identify what products people search for. We detected 118 subcategories; these are the 20 with the highest average monthly search volume.
- Armchairs and recliners
- Beds
- Lamps
- Chairs
- Desks
- Furniture
- Sofas
- Curtains and rods
- Rugs
- Mirrors
- Mattresses
- Futons
- Coffee tables
- Bunk beds
- Coffee makers
- Planters
- Shelves
- Tableware
- Nightstands
- Bases and headboards
Purchase intent
14 search patterns in Home and Decor
People carry real, everyday language into their queries. Understanding these intentions helps improve customer experience, design content for an omnichannel context, boost brand visibility, and identify business opportunities.
Branded searches (include a brand)
24%of keywords · Top searches: Sodimac, Falabella, Ripley, Lider, Homy
By type of room
10%of keywords · Top searches: Kitchen, Patio, Bathroom, Dining room, Living room
By material type
10%of keywords · Top searches: Wood, Glass, Textile, Natural fibers
By design style
7%of keywords · Top searches: Rustic, Modern, Vintage, Modular, 3D
Product features
“turquoise sofa”, “round coffee table”
Space features
“shelves for small kitchens”, “armchairs for small spaces”
Design style
“rustic lamps”, “modern coffee tables”, “vintage nightstands”
Price factor
“hallway rugs on sale”, “budget closets”
Movie and game fans
“baby yoda mug”, “gaming armchairs”, “star wars bowl”
Generic
“tv console”, “cushions”, “rugs”
Places and neighborhoods
“curtains independencia”, “furniture barrio italia”
Product brands
“ursus trotter coffee maker”, “cannon pillows”
Retail brands
“sodimac bathroom accessories”, “falabella hanging lamps”
Life moments
“baby shower decorations”, “nursing cushions”
User segments
“folding kids table”, “bunk bed for kids”
Season and special dates
“christmas cookie cutters”, “winter bedspread”
Type of room
“bathroom accessories”, “kitchen rugs”
Material type
“wooden dresser”, “rattan patio sets”
e-commerce and marketplace ranking
Who's winning the category on Google Chile?
We measured share of search —searches that include a brand name— and each player's organic positioning across the study's 5,830 keywords.
Share of search
Each brand's share of the category's branded searches (24% of total keywords).
- Sodimac16.3%20.1% including Homecenter
- Falabella10.6%
- Ripley9.5%
- Lider9.1%
- Homy7.7%
Organic positioning
Percentage of category keywords in which each player leads the top mobile search results.
- mercadolibre.cl54%
- sodimac.cl43%
- falabella.com33%
- paris.cl14%
- ripley.cl10%
Mercado Libre has the best average position in the category: top 7 on desktop and top 6 on mobile. Charts by FREED using Semrush data.
Market niches
Over 500,000 searches are waiting in the long tail
Competing for generic terms like “furniture” —33,000 monthly searches and high difficulty— is very hard for a new e-commerce. Long-tail keywords have lower volumes, but low competition, making it possible to capture opportunities within reasonable timeframes.
Detected niche example
“rustic wooden furniture”
- +4,000 searches a month on Google Chile
- Medium-low difficulty · low competition
- Related: rustic wood shelves, rustic wood coffee table, rustic wood chairs
Breakdown of the 5,830 keywords
- Non-branded long tail27%
- Branded long tail10%
- High-difficulty keywords63%
Non-branded long tail keywords amount to 536,290 searches across 104 product subcategories.
How we did it
Study methodology
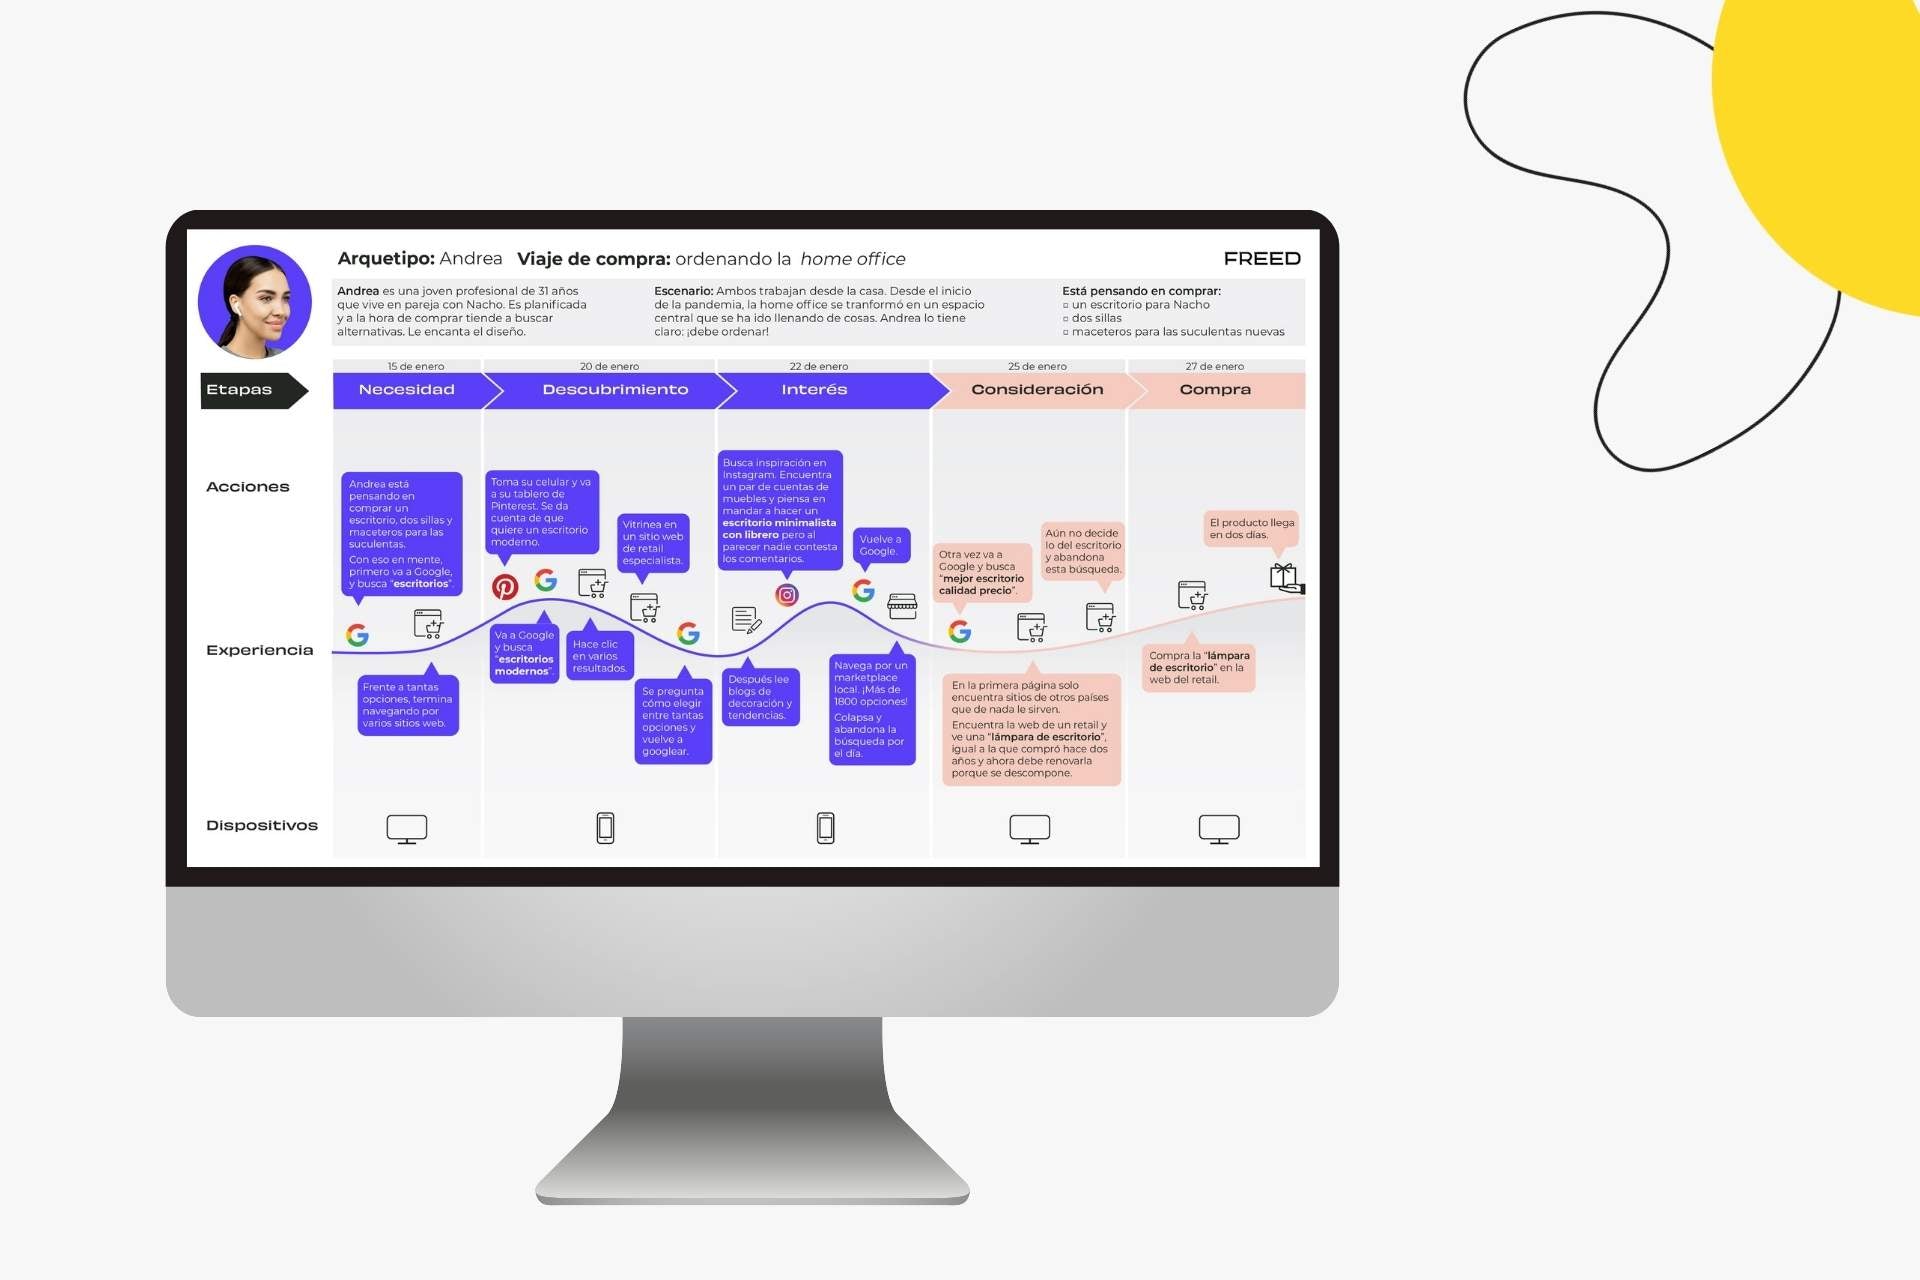
We started with an initial sample of 35,983 keywords gathered from categories and subcategories of e-commerce and marketplace sites, and narrowed it down to 5,830 keywords using relevance and volume criteria. The study includes the buying journey of “Andrea,” a digital consumer archetype furnishing her home office.
- Ubersuggest: keyword research
- Semrush: ranking of the 17 players
- Similarweb: player web traffic
- Google Trends: trends over time
- Google Chile · desktop and mobile
- Period: January to April 2021
Who is this study for?
E-commerce Managers to understand their store's organic positioning and apply continuous-improvement cycles based on real search queries.
Brand & Category Managers to align the product buying journey with users' real search intent.
Entrepreneurs and brand owners evaluating whether to launch their own e-commerce or sell on marketplaces and needing to validate market niches.
SEO teams and marketplace sellers looking to capture long-tail opportunities and build synergies between SEO and SEM.
Note: this study was originally conducted and written in Spanish, so the downloadable PDF is in Spanish.
Armchairs and recliners, the most searched subcategory
Beds and mattresses, among the top 5
Lamps: rustic styles lead the category
Kitchen, the most searched room
Coffee makers, among the top 20 searches
Planters and succulents: Andrea's home office
“The key question for any stakeholder is: are you taking advantage of every opportunity e-commerce has to offer?”