You can also find Customer Journey content in podcast format
We want to share with you the most used methods in user research, which is why we are publishing a series of articles on the subject. This time we will talk about the Customer Journey.
Here is a guide with the necessary information to get started in customer journey mapping.
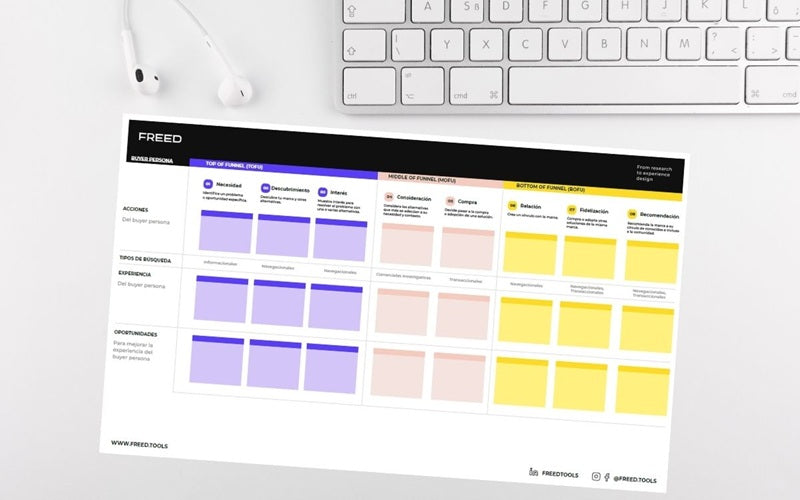
Additionally, you can get the Customer Journey template that we use as a basis for the reports we deliver to our clients and for doing this exercise with them. At the end of the article, you will find the button to download it.
Get our analysis in your inbox
Subscribe to the FREED newsletter: applied research, trends and tools.
No spam. Unsubscribe anytime.
What is the Customer Journey?
This is a research method widely used in social sciences and has become known in recent years in engineering, marketing, and management, to get closer to people. It helps understand the user experience, mapping the steps and stages in the interaction with a system, product, or service.
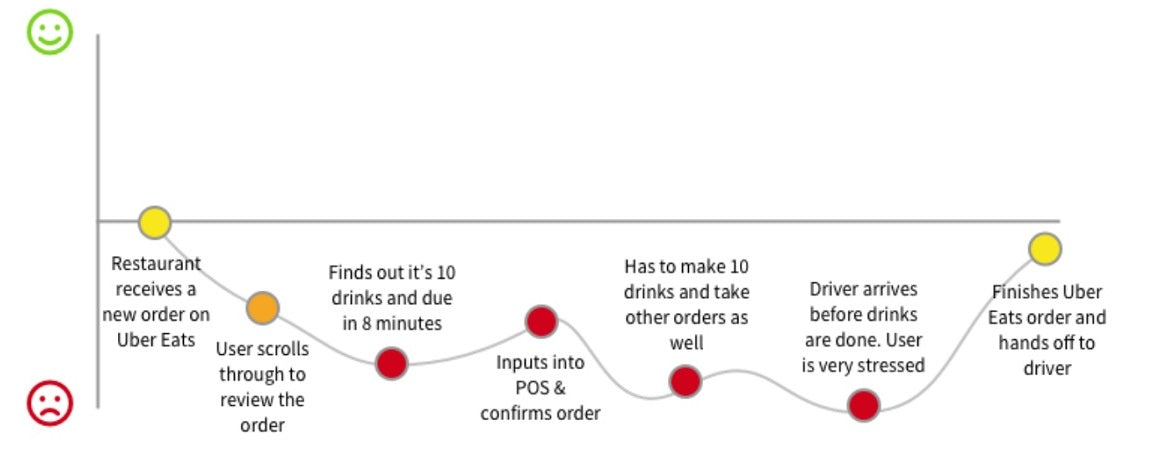
For example, here we have the real journey of a restaurant worker (the user) who takes orders coming from Uber Eats, which shows that the experience is quite negative and stressful:
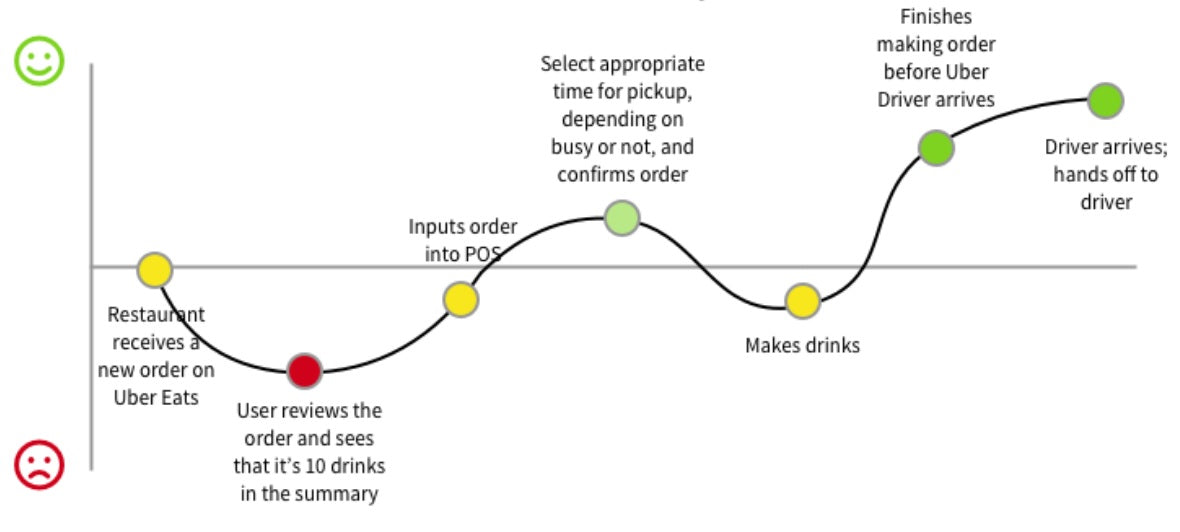
Now let's compare it with the ideal journey (originally designed) that should be taken to achieve the objective:
Source: Mandy Zhang
The differences or gaps we detect between the real journey and the ideal journey allow us, as experience developers, to identify opportunities for improvement in the design or redesign of the service or product.
Mainly, we use the Customer Journey to:
Tell the story from the people's point of view.
Visualize the story with the support of data, illustrations, photographs, etc., giving greater force to the narrative.
Identify areas for improvement, especially in current research.
Design a future service when we make experience definitions. In the case of the examples we just saw, it is based on a snapshot of what is happening, with the good and the bad, versus the design of the ideal we want to approach, the standard that not necessarily all people will experience.
Who can be the customer:
A customer of the service or product.
A company collaborator or internal user.
A patient.
A nurse, etc.
The customer is always a person, whether it's a service or product aimed at the end consumer or a system designed for businesses (e.g., Slack, Microsoft Outlook, etc.). When we design services and products for businesses, ultimately, the user will always be a person. We can even use the User Journey to design with a specific person in mind, such as a call center executive at a company.
Customer Journey versus User Journey
In this article, we are talking about Customer Journey, but you have probably also heard the term User Journey. While they are partial synonyms and often used interchangeably, it is necessary to clarify that there are nuances between both concepts:
User Journey is an approach focused on the use of a system: mobile application, website, software, etc.
Customer Journey is usually a broader view, an approach focused on the company: the use of a service and the overall experience.
What is the purpose of the Customer Journey?
Mapping the customer journey allows you to:
See things from the customer's point of view.
Bring the customer closer to company employees who do not deal with the public ("back office") and are not directly seeing people's experiences.
Identify opportunities for improvement.
Identify the best moments to impact the experience, because not all touchpoints or moments are equal.
Focus on moments with the biggest gap. In a context of limited resources, if we want to redesign a product or service and have to prioritize, this type of visualization allows us to identify where to start.
Compare the current situation with the ideal, as we saw in the examples.
Some best practices for mapping a Customer Journey:
From the beginning, consider who will use the "deliverable" (the visualization) and for what purpose. It is different to communicate it to a technical area (technology, design) than to a management area that is not as involved in daily operations.
Avoid overly long visualizations that can be printed. Journeys are usually printed and hung on the wall to visualize the customer experience every day, and that format is different from a letter-sized report.
Do not start drawing or visualizing before systematizing what was gathered in the research phase. More than having a pretty visualization, it is necessary for it to reflect the data we have obtained in our research.
Do not jump to conclusions. It is important that everything that catches our attention is reflected in artifacts derived from the research, without skipping stages or starting to project prematurely. We must take the time to first show what we have found and then proceed to analyze, identify gaps, and seek solutions.
Do not invent steps or stages that are not covered by the research. Basically, as an artifact, the journey must reflect the research questions we asked and the stages we have mapped. If we have not asked something of the data, we cannot invent it.
Visually highlight important stages to draw the reader's attention to this artifact.
Vocabulary
Touchpoint is the point at which the user interacts with the product or service. It is something concrete:
In the case of a mobile application, the touchpoint is the app itself.
In a physical service, it can be a company branch, but it is a channel where there can be several touchpoints: a person who serves customers, a self-service kiosk with an electronic screen, etc.
Service or contact channel: From the company's perspective, it is a concept that encompasses a management unit (e.g., the e-commerce site, the branch, the call center). For people, this separation generally does not exist. Furthermore, as we said, a service channel can have several touchpoints, but it is a point of contact for the person serving, not for the customer.
Moment of truth: The moment when the user comes into contact with an element of the company (e.g., downloads an application, is attended to at the call center, receives a form or letter by mail). These are key moments.
Pain point: The moment when friction or a gap in the service is observed, or something is not working.
Insight: The "Aha!" moment. It's the moment when, as researchers, the light bulb goes on for us. Beyond making an observation, we are understanding what is happening. Here it is necessary to make a distinction:
An observation is a record of what people say or do.
An insight is a non-obvious finding.
Let's look at an example of an insight:
In a study we conducted with seamstresses, we observed that they all have a sewing workshop in their homes. Through this activity, they generate economic resources for the household, often accounting for half or more of the family income. For us, they were micro-entrepreneurs who generated businesses, and some even employed other people.
However, when it came to signing the confidentiality agreement — a standard form where they had to write their RUT, name, surname, and profession — many of the seamstresses declared themselves as "Housewife."
Here the insight is: despite being actively employed and generating income, the research revealed a lack of self-worth among these individuals. Simply because they lacked formal education, they considered themselves housewives.
That's why it's important for researchers to go beyond the obvious: in addition to looking at data and observing, it's crucial to interpret and analyze.
How to map the Customer Journey
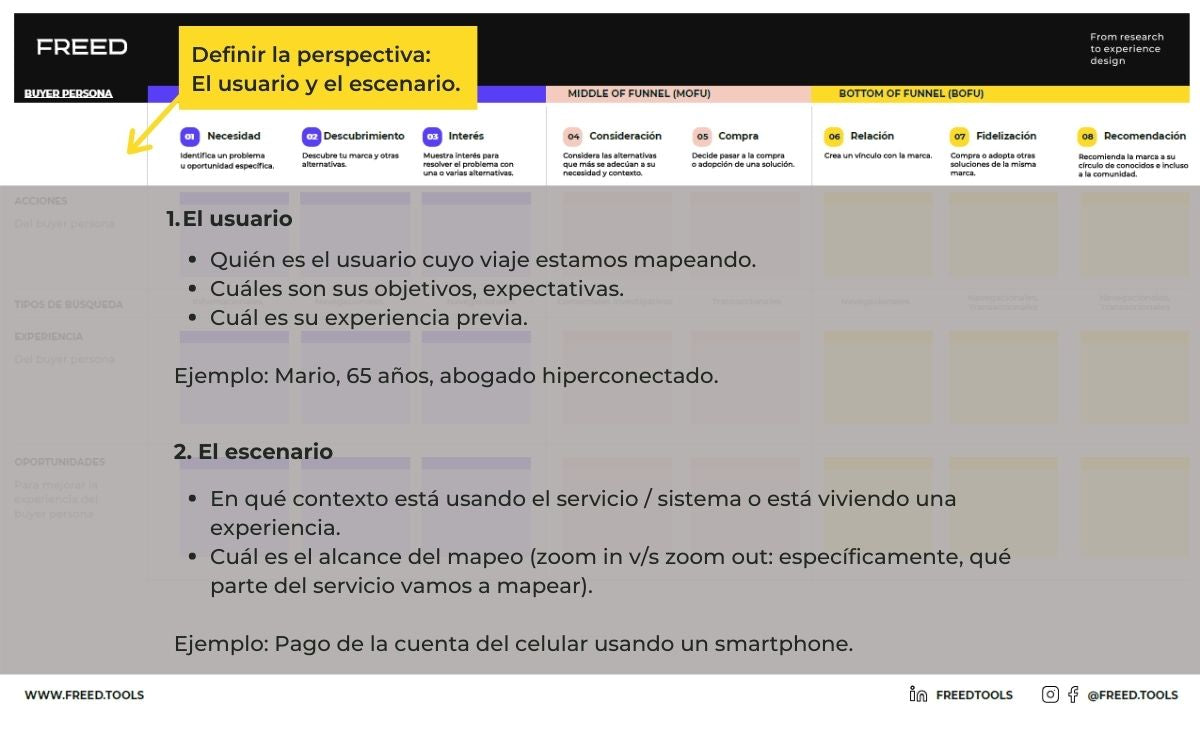
Using the same template you can download, let's review a fairly simple methodology that begins by defining the perspective. In the example we saw, the perspective was that of the person who receives and prepares orders in a restaurant.
When we talk about perspective, we must also understand the user's expectations, previous experience, needs, and objectives, and what they are generally like, before starting to map their experience.
This perspective also implies understanding that there are always multiple users, but we must select only one to map their journey. That's why we must understand what the user is like, because, undoubtedly, the situation of a 75-year-old hyper-connected lawyer would be very different from that of a 25-year-old who is reluctant to use technology. The idea is that this comes from the data itself, from the knowledge we are generating about people.
Additionally, we must define the use scenario, the context in which the service or system is being used and where the experience we want to study takes place. For example, paying the mobile phone bill via mobile, which would be very different from doing it at a branch.
Click on the image to enlarge it and see the instructions:
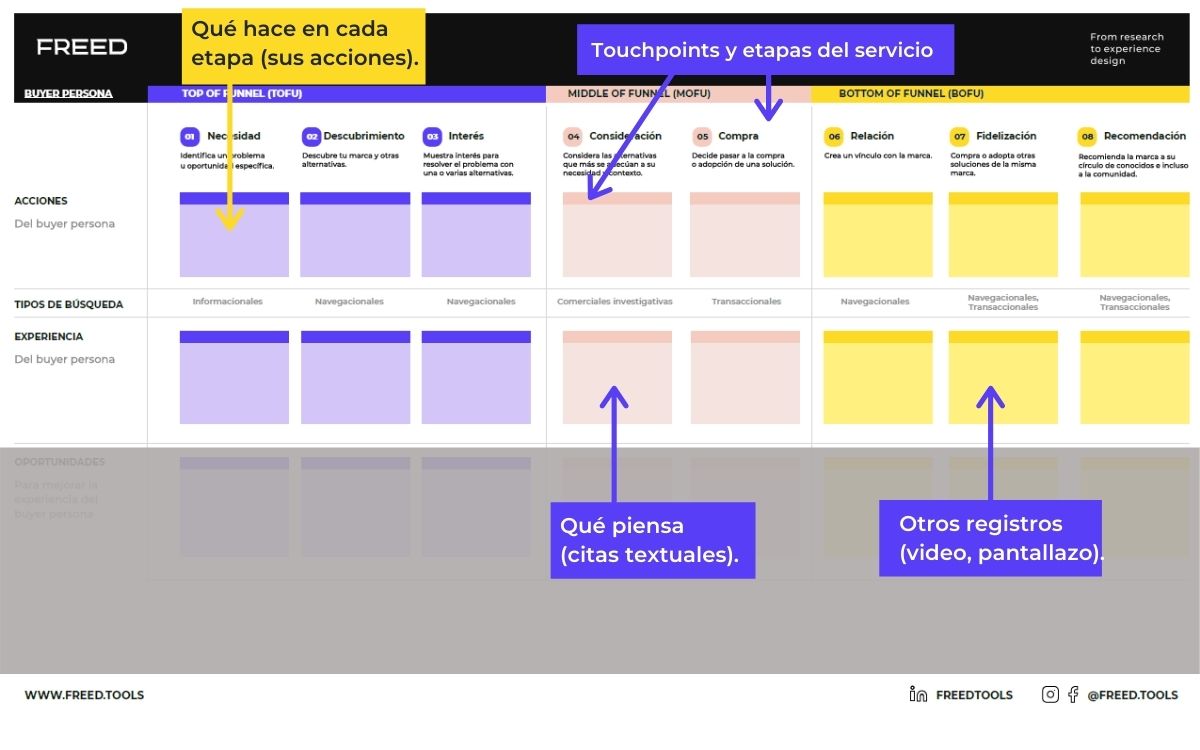
Next, we will record the customer experience. We must map each of the stages, giving them names like pre-service, service, post-service, which depends on the zoom in or zoom out we apply.
The division of the experience has to do with touchpoints and service stages, and it is very relative depending on the context. Because in the case of a purchase service, we might want to see the complete journey, from pre-sales to loyalty and recommendation.
It may also be that we only want to investigate the post-sales experience, to know what is happening with the person after they bought, if they are already a customer and how we are serving them, who is serving them, if they have had any problems with the service, if we are solving the problem and how long it takes us; something we can see in transaction logs, mystery shopper sessions, etc.
In other words, it always depends on how we design the research, what we want to find out, and what we have at our disposal.
For example, if we look at the purchase experience with a brand, the journey can begin with information search and continue with reference search, the sales stage, and after-sales.
When mapping, we must highlight the high, neutral, and low moments, graphically represented by a continuous line that draws curves. That is, we have to visualize if the experience at a point has been neutral and requires improvement, negative because the service is unfriendly, or positive and remarkable.
Something important about the journey is that it is quite visual and allows us to empathize with the person even if we haven't talked to them, which is why it is important to show textual quotes, videos, screenshots, and hard data, if we have them.
Click on the image to enlarge it and see the instructions:
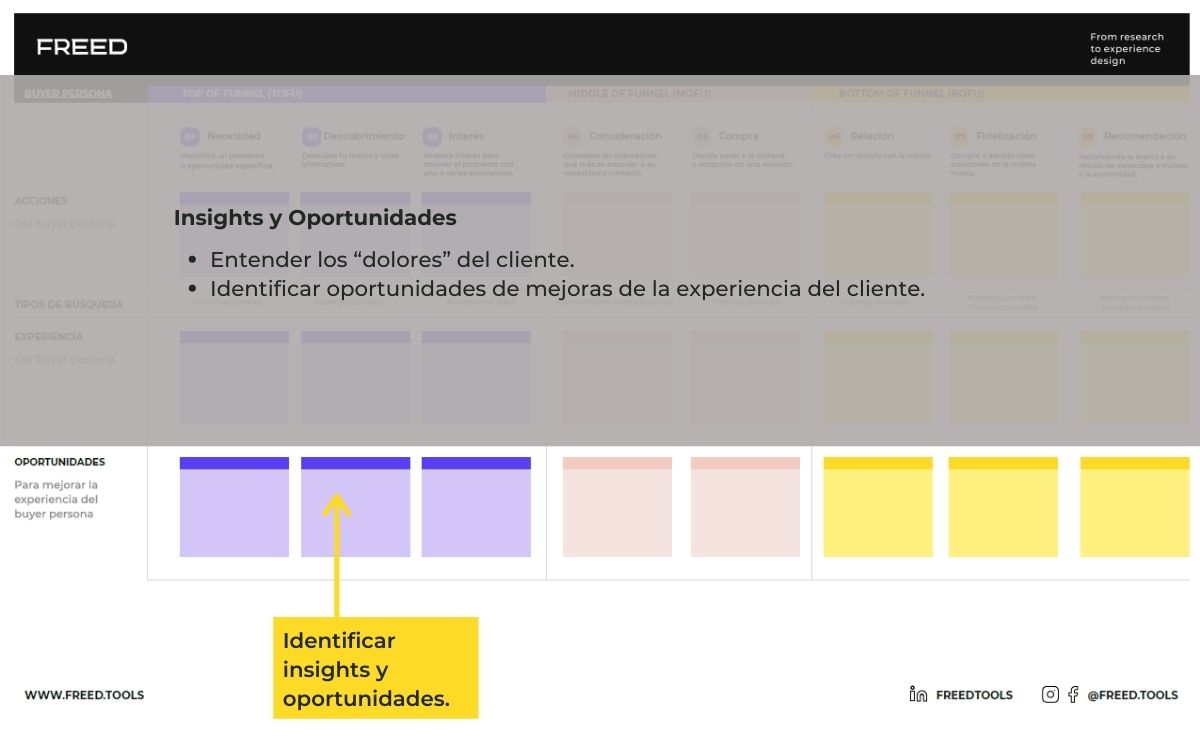
Thirdly, we will identify insights and opportunities. By analyzing the user experience at different touchpoints and moments, we can extract information that helps us detect feasible improvements to incorporate into a design or redesign process for a product or service.
Click on the image to enlarge it and see the instructions:
How do we map the journey in practice?
1. Research stage
To obtain the data that will allow us to map the customer journey, we can resort to different research methods. The choice of methods we will use will depend on what we want to look at and what we have available. In more technical terms, everything will depend on the research design.
Generally, we use more qualitative methods (for example, interviews instead of surveys), because we want to know in more detail why things are happening.
To get people's point of view and a greater richness of data, a combination of methods, two or three, depending on what we want to investigate, must be used, but we must always resort to at least one qualitative instance.
Observation: Although it is more suitable for in-person experiences (a branch), there are also approaches for virtual contexts.
Mystery shopper: Participant observation. When the researcher lives the customer experience.
Diary: We can ask people to take notes of their experiences, to study them later.
User's personal notes.
Traditional support (a paper notebook) or mobile (note-taking app).
Probes: Evidence of what the user does, to complement or triangulate what they say. This allows us to see what technologies they use, how they organize their things, what they have closer at hand and further away, etc.
Quantitative methods, such as:
Transaction log analysis.
Web analytics.
Surveys.
Objective data sources: To identify what people do versus what they say they do.
2. Systematization stage: identify customer archetypes and map the journey of each one
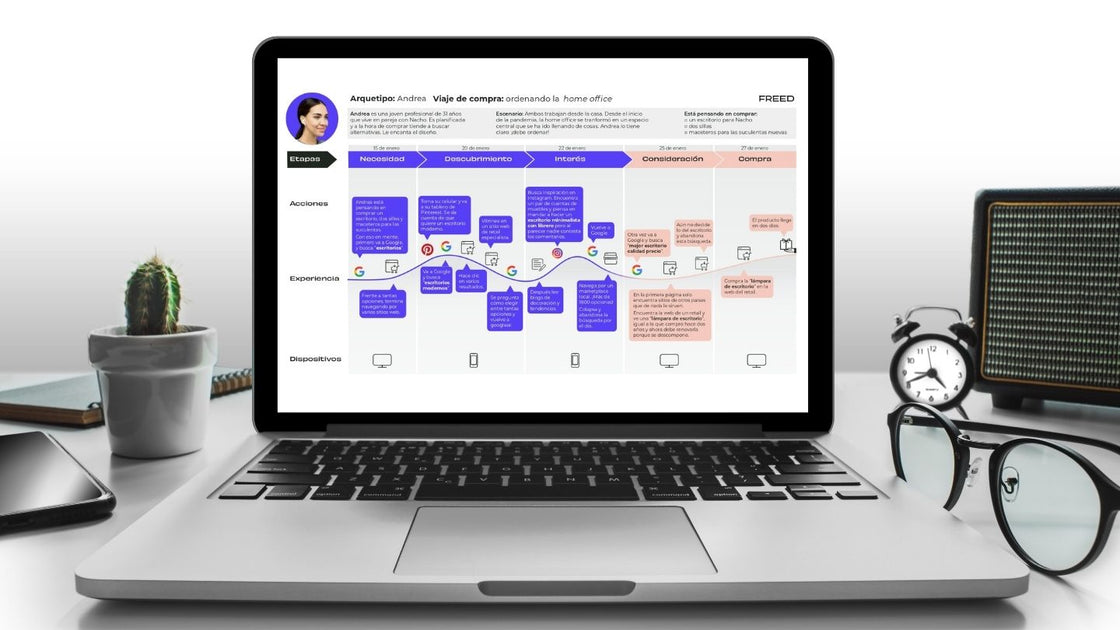
Example #1: Customer archetype and their journey with a bank's mobile app
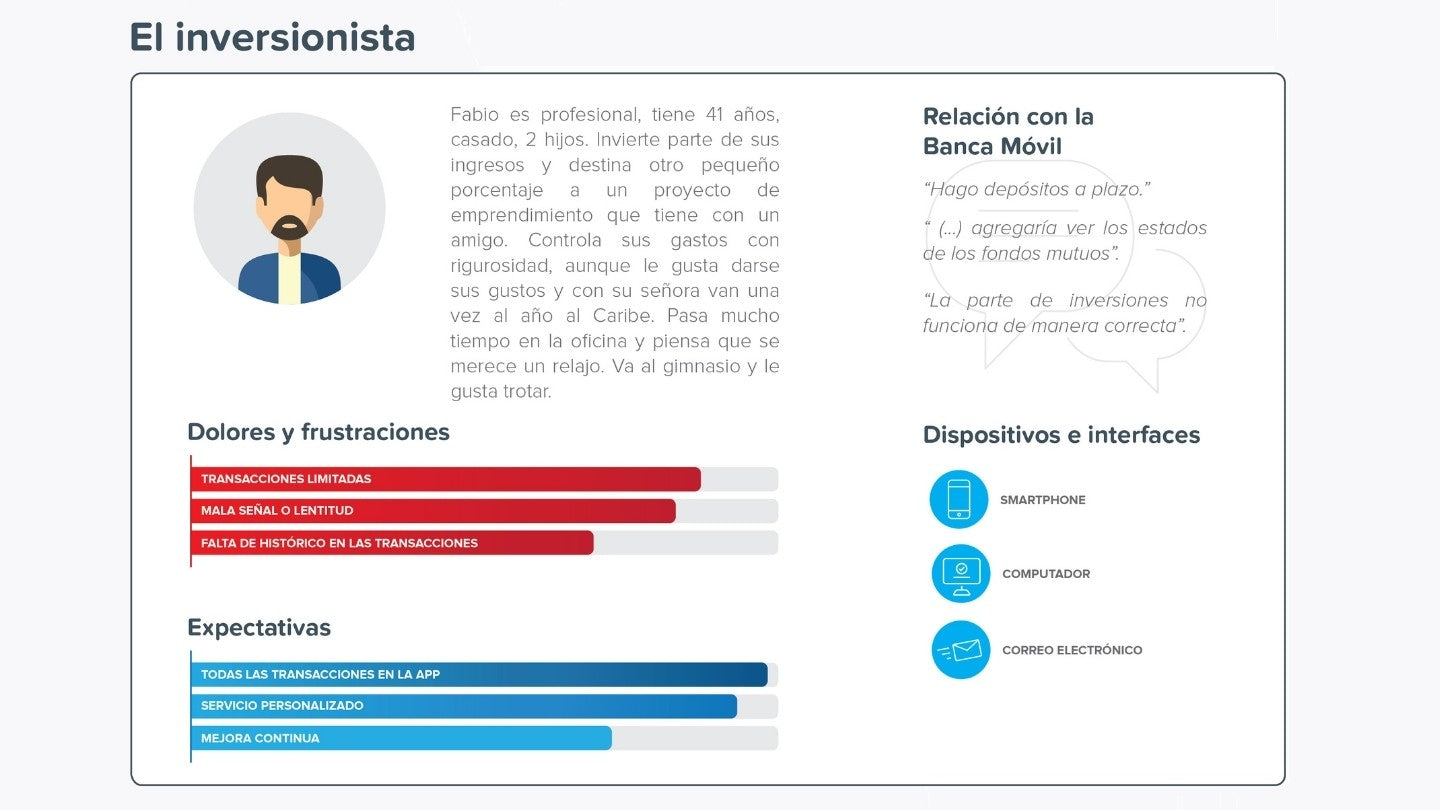
Here we see one of the customer archetypes we obtained when conducting a study on mobile banking in Chile. We identified behavioral patterns and described them, giving identity to each archetype. We assigned them names, noted several of their characteristics as users, what technologies they use, and their relationship and experience with mobile banking.
In that study, we identified five archetypes, which means we mapped five different journeys.
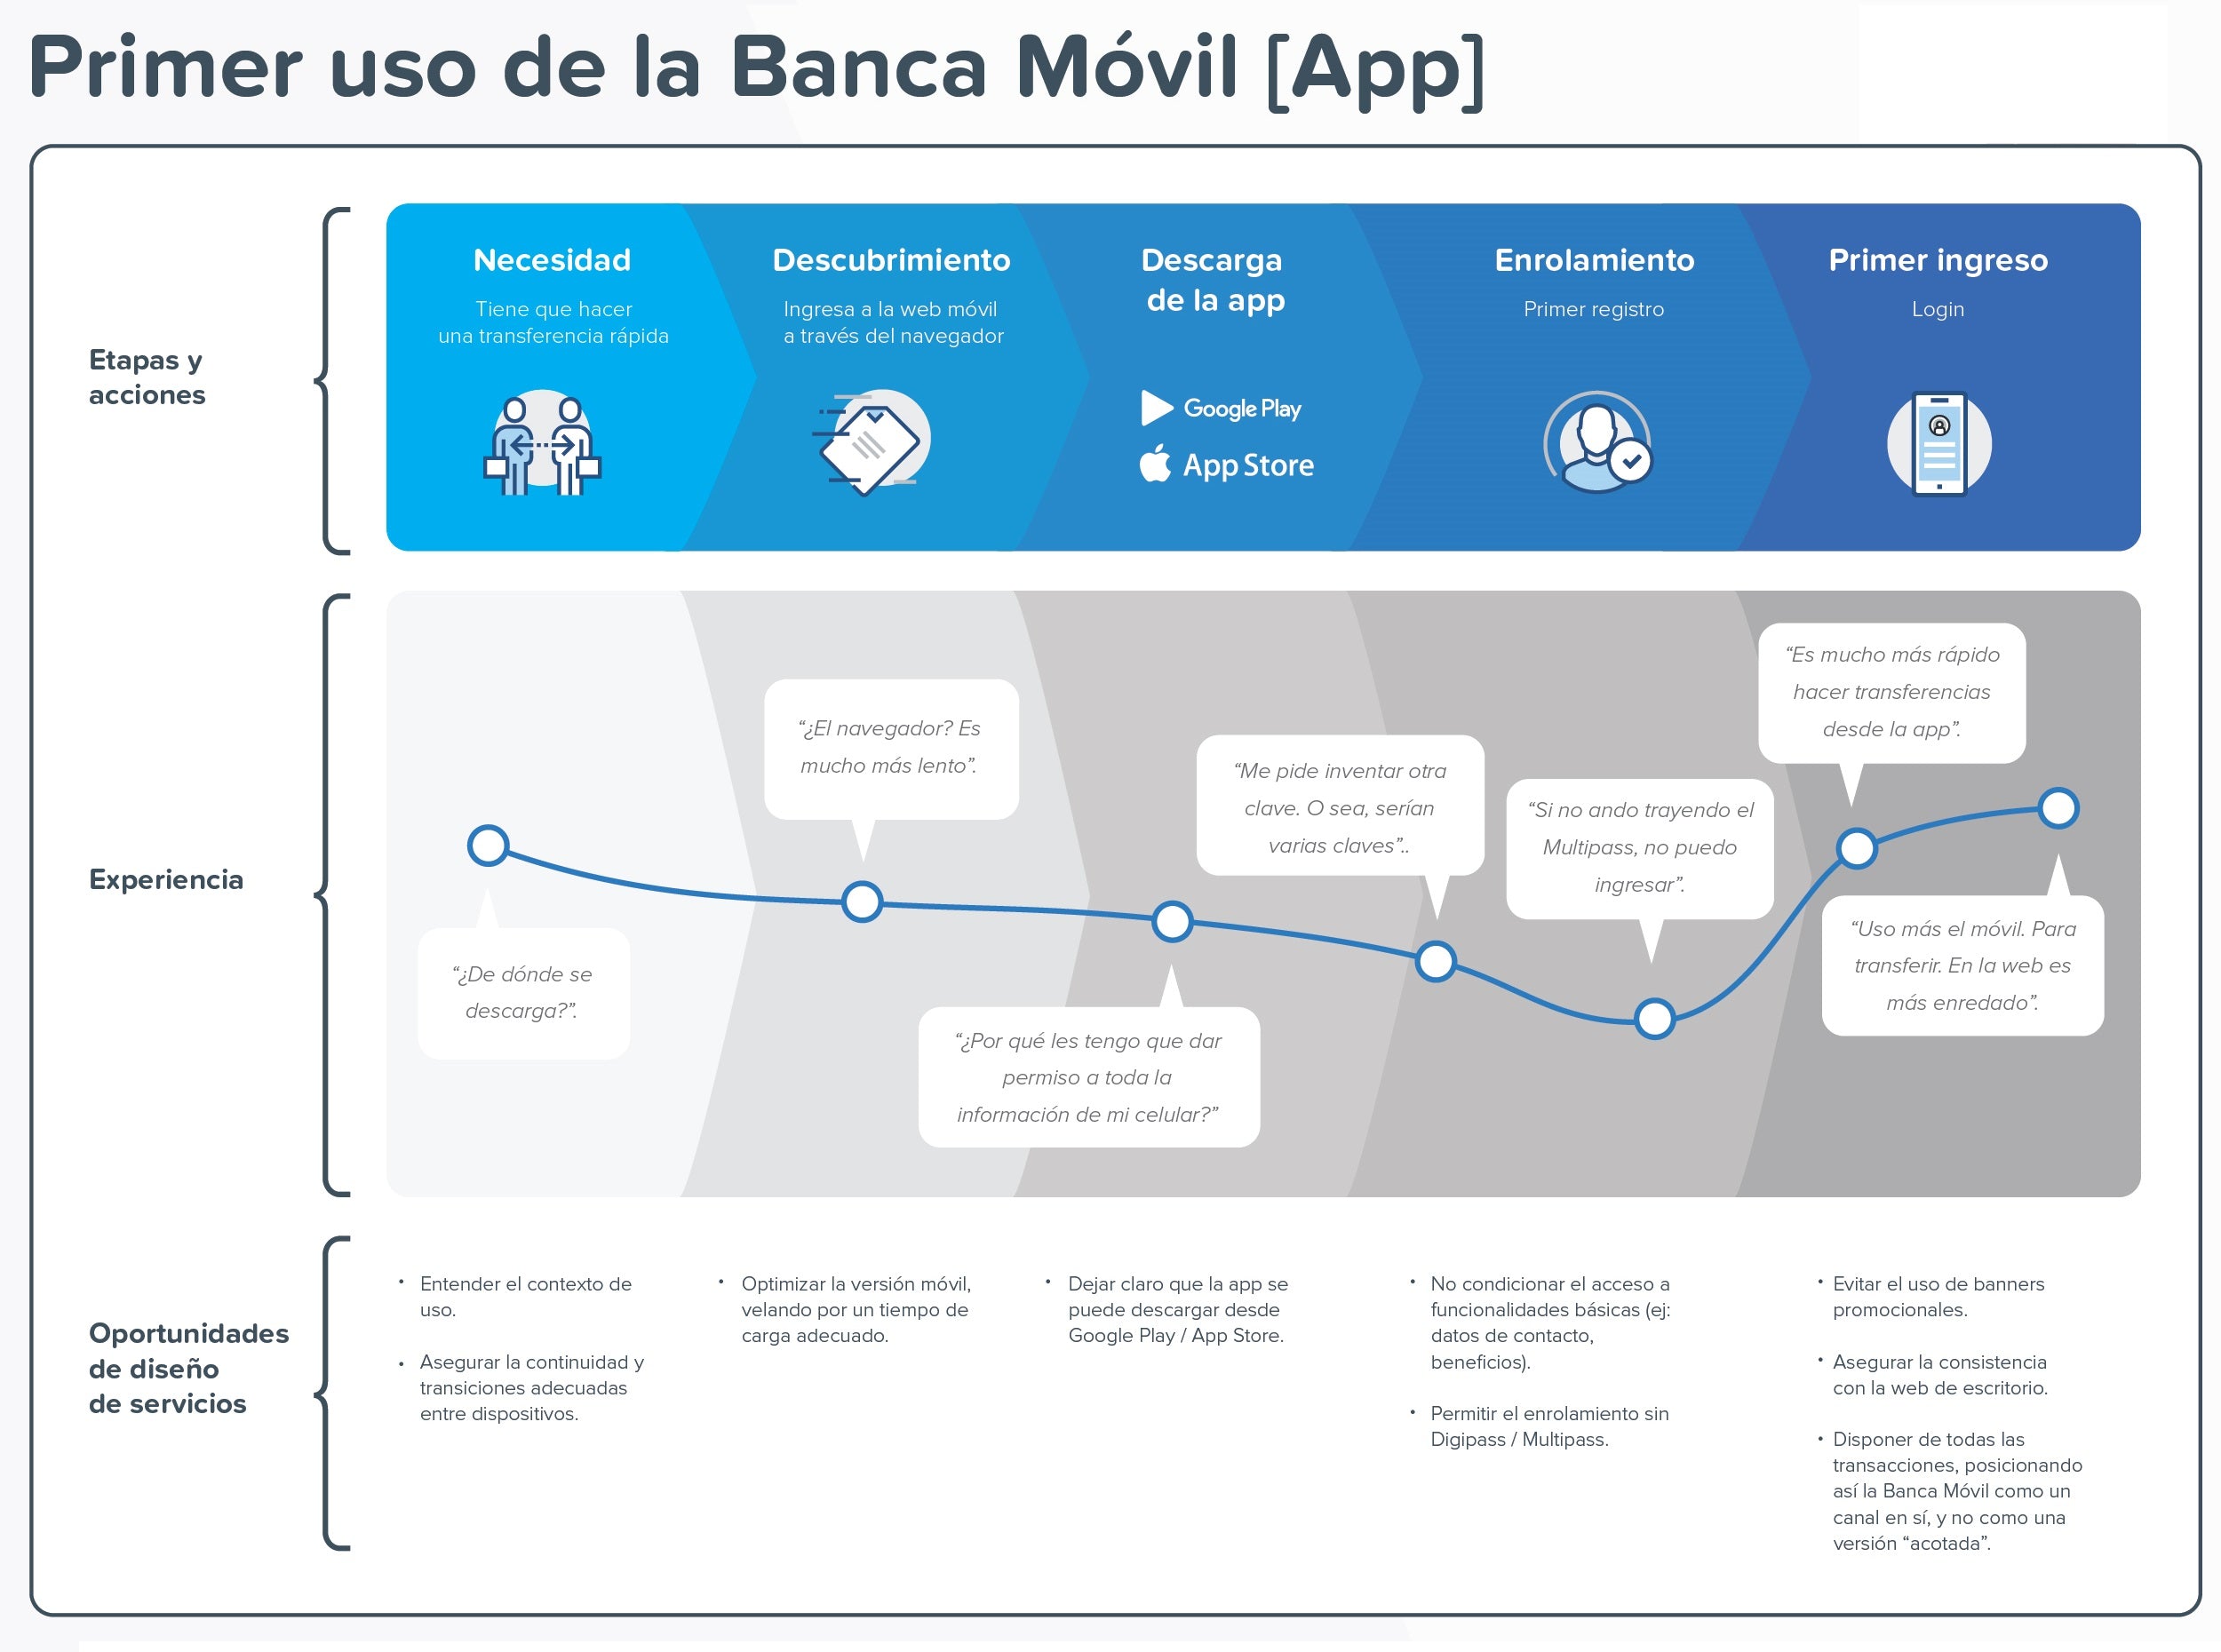
In this study, we wanted to understand the interaction with the bank's mobile application for a customer who downloads it for the first time. This involves downloading the app, enrollment, and the first login.
The customer journey you can see below synthesizes three of the four scenarios we managed to identify:
The customer enters the bank's mobile site and accesses their private area.
The customer enters the bank's mobile site, downloads the app, registers, and logs in.
The customer goes directly to Google Play or the App Store and downloads the app.
A zoom-in could be done to see the nuances of each case to identify gaps and opportunities for improvement.
Click on the image for details:
Example #2: customer journey with another financial company
Click on the image for details:
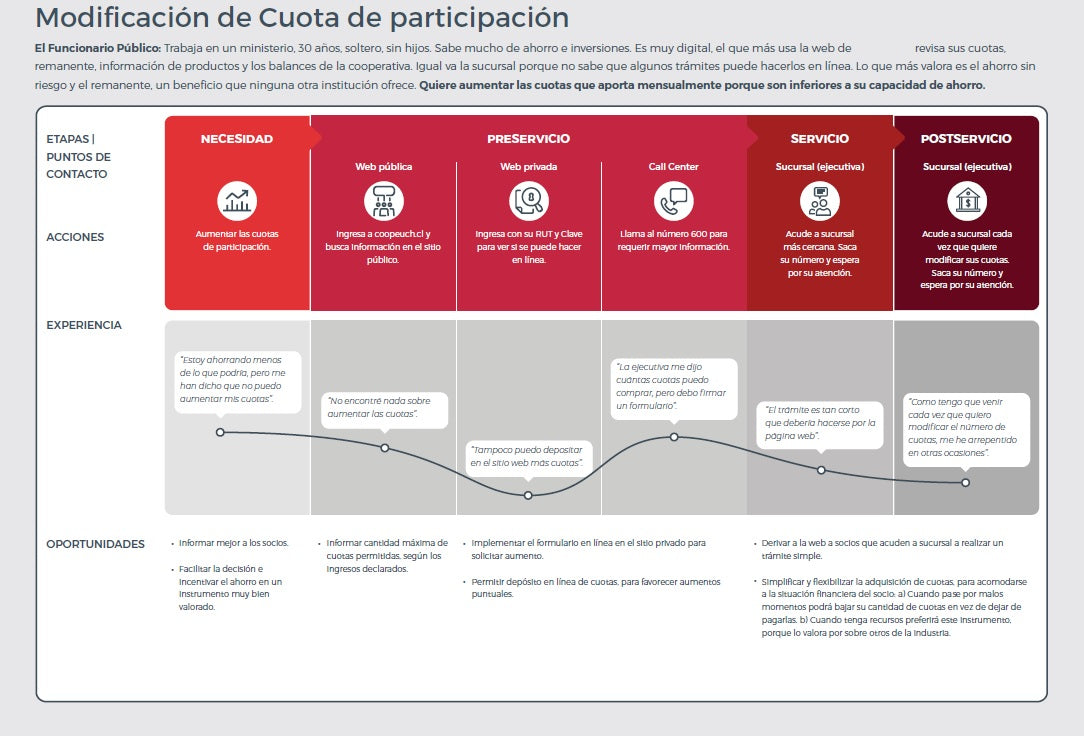
Now we see a customer journey that we mapped for a study we did with a financial company. We also managed to detect several customer archetypes, and the journey you see below corresponds to one of them, which we called "The Public Official," and visualizes their journey making changes to their participation quotas as a member of that institution.
In this journey, the stages range from detecting a need (to increase the participation quota) to the post-service received at a branch, passing through a pre-service stage with three touchpoints (public web, private web, and call center) and another service stage. You can also read textual phrases that describe their experience at the different stages and touchpoints.
This customer journey contains all the sections we have described.
Final tips
As we said before, it can be good to zoom in on one of the stages or look at the service as a whole.
At this point, it is important that when choosing the methods you will use, you consider the characteristics of the Customer Journey as an artifact:
It is a visual representation of the customer's reality.
It is not an end in itself. It is a stage in a process.
It must lead to concrete actions (be actionable).
It must be self-explanatory or easy to understand by someone without reading a detailed project report.
It shows important stages and not micro-details like a process map or service blueprint.
While quantitative data can be used to generate it, the curves do not necessarily reflect statistics but rather trends, with specific accents. That is, an upward curve does not imply an X% increase in customer satisfaction.
Finally, it is essential to evidence the process. In addition to showing the guidelines and protocols we have used in the research, the Customer Journey must specifically contain quotes or other evidence of the process such as:
Notes / Sketches / Drawings
Audio
Photography
Video, if the format allows it
Why is it important to have guidelines and protocols? As researchers, we cannot rely solely on our memory to collect everything we want to evidence. We must have artifacts such as interview guides and protocols to collect comparable data, even if there is room for spontaneous questions and answers. If you want to delve into other methods and UX Research in general, we invite you to explore the articles on the Experience [UX / CX] blog.
If your customer journey includes in-person moments, the physical touchpoint is designed too: from the front desk to the room, as happens when booking hotels and event venues in LATAM.
Download the Customer Journey Template
As we mentioned, here is the template for mapping the User Journey or Customer Journey that we use at FREED with our clients.
To run these exercises collaboratively and remotely, at FREED we use digital whiteboards such as Miro, which let you map, cluster and vote with the whole team in real time. (Affiliate link: signing up through it supports FREED at no extra cost to you.)
Share this article
Follow us on YouTube
Nuevas Economías, Research Thinking and FREED AI Studio: conversations and analysis on business, technology and human behavior (in Spanish).

 By
By ![Customer Journey: What it is and How to Map it [Complete Guide]](/content-images/6b03118e-portada-user-journey.jpg)