The empathy map is a visual tool that organizes what a user says, thinks, does, and feels about a problem into quadrants, so that a team can build a shared understanding before designing a solution. It serves to put the evidence collected in interviews or observation in writing, instead of basing design decisions on assumptions. It is a key tool when building customer archetypes based on real evidence.
The empathy map is drawn as a circle divided into quadrants, with the user's name or photo in the center. Unlike a user archetype, which summarizes a complete profile with goals and frustrations, the empathy map focuses on a specific moment or context: how that person experiences the problem the team is trying to solve.
In our workshops, we use it as a bridge between research and idea generation: it is completed right after interviews and before brainstorming, to ensure that the team designs from evidence and not from their own intuition.
The classic version has four main quadrants, plus two additional strips:
- Says: verbatim phrases that the user expressed during an interview or conversation, in quotes and without paraphrasing.
- Thinks: beliefs, concerns, or expectations that the user did not necessarily verbalize, but that are inferred from their tone, pauses, or context.
- Does: observable actions, such as the steps they follow to solve the problem today, including shortcuts or improvised solutions.
- Feels: emotions associated with the experience, from frustration to relief, which often explain why they make certain decisions.
- Pains: obstacles, risks, or fears that prevent them from achieving what they need.
- Gains: results, benefits, or desires that the user seeks to obtain.
Completing all six fields with the same evidence forces the team to cross-reference information: a phrase from the "Says" quadrant should be able to be explained or contradicted by something from the "Does" quadrant, which reveals interesting tensions for design.
The empathy map is not filled from memory or by team consensus: it is completed with evidence collected directly from users. The most common sources in our projects are:
- In-depth interviews, the main source, especially for the "Says" and "Thinks" quadrants.
- Field observation, key for the "Does" quadrant, because it shows behaviors that the person does not always report accurately when interviewed.
- Recordings or field notes, which allow quoting verbatim phrases without distorting them weeks later.
- Support or complaint records, useful for the pain quadrants when there is already a commercial relationship with the user.
If the team does not have recent evidence, the correct thing to do is to schedule a brief round of interviews before the session, instead of completing the map with assumptions disguised as findings.
In e-commerce projects, for example, we have seen that the "Does" quadrant reveals shortcuts such as comparing prices in another browser tab while completing checkout, a behavior that rarely appears if you only ask "how do you shop online?" in an interview. Crossing that observation with the "Feels" quadrant (anxiety about overpaying) helps the team prioritize concrete improvements, instead of discussing "improving the shopping experience" in abstract.
A sequence that works for us with teams of 3 to 6 people, in sessions of 45 to 60 minutes:
- Draw the circle with the six fields on a large flip chart, with enough space for post-its.
- Review the notes from recent interviews or observations together, before starting to write on the map.
- Each participant writes findings on individual post-its, one per idea, and places them in the corresponding quadrant.
- Group similar post-its and discard those that are team opinions instead of user evidence.
- Conclude by identifying two to three tensions or contradictions between quadrants, which are usually the starting point for generating ideas.
A detail that makes a difference: asking participants to cite the source of each post-it (for example, "interview 3, minute 12") helps distinguish real observation from personal interpretation.
- Completing it without real evidence. This is the most common mistake: the team writes what they think the user would say, instead of what they actually said or did.
- Mixing several user profiles in a single map. If there are segments with different needs, it is advisable to make a map for each one.
- Confusing the "Thinks" quadrant with the "Says" quadrant. What the person says aloud does not always match what they really think or fear.
- Leaving the map stored without using it. The empathy map should connect directly with the next stage, whether it is defining the design challenge or generating ideas.
It is common to confuse the empathy map with a user archetype or a buyer persona. The main difference lies in the level of synthesis and the moment they are used: the empathy map is an intermediate analysis tool, which organizes raw evidence shortly after collecting it, while the archetype and buyer persona are already consolidated profiles, designed to communicate findings more permanently to the rest of the organization.
A practice we use in our workshops is to first complete one or more empathy maps with evidence from interviews, and then use them as direct input to build the archetype or buyer persona, instead of skipping that intermediate step.
If you want to see examples of these exercises applied in real workshops, you can subscribe to the FREED YouTube channel.

 By
By 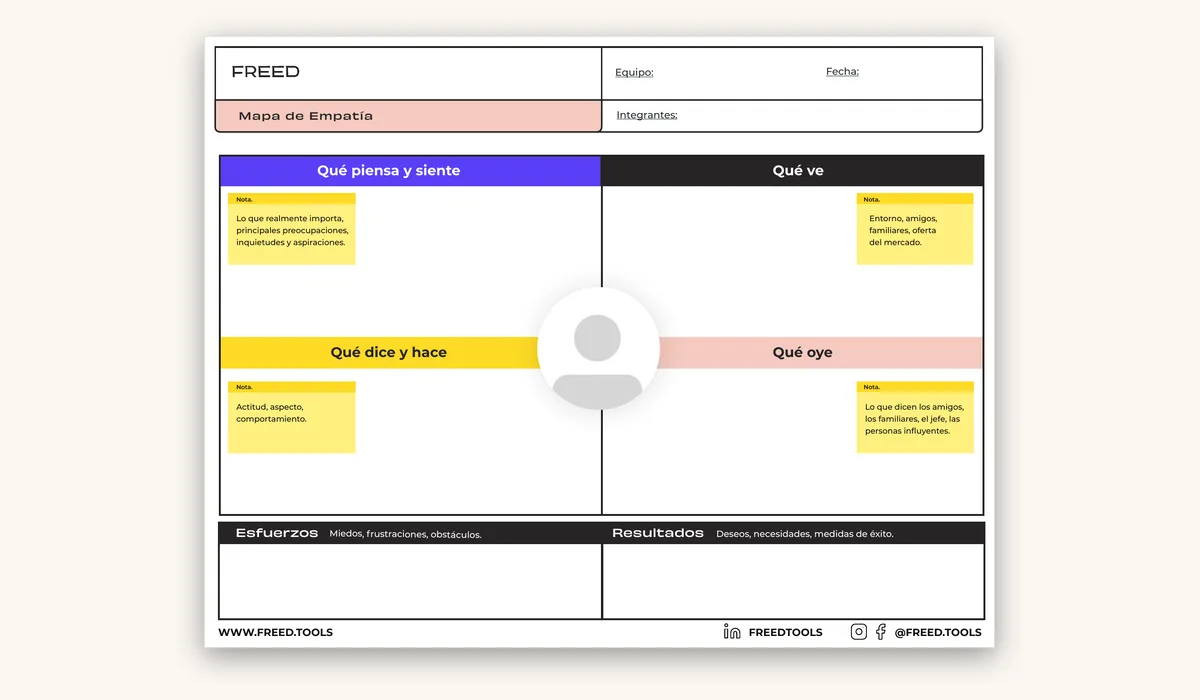

![Digital Marketing Strategy: Mistakes to Avoid [Part 3]](/content-images/859a0087-errores-ideas.jpg)